
Blog ini merupakan kelanjutan dari bagian sebelumnya. Jika belum membacanya, bisa cek disini.
Langkah Implementasi
Instalasi dan Konfigurasi Tools Prometheus.
Note : Lakukan langkah dibawah ini di monitoring node.
- Download dan ekstrak file Prometheus.
~$ sudo su -
~# cd /opt
/opt# wget
https://github.com/prometheus/prometheus/releases/download/v2.48.1/prometheus-2.48.1.linux-amd64.tar.gz
/opt# tar xvfz prometheus-2.48.1.linux-amd64.tar.gz
- Menambahkan file konfigurasi untuk Prometheus.
/opt# cd prometheus-2.48.1. linux-amd64
/opt/prometheus-2.48.1. linux-amd64# vim config.yml
---
global:
  scrape_interval:     10s
  evaluation_interval: 15s

scrape_configs:
  - job_name: 'node'
    scrape_interval:  5s
    static_configs:
    - targets: ['192.168.4.10:9100','192.168.4.20:9100','192.168.4.30:9100']

  - job_name: 'nginx'
    static_configs:
    - targets: ['192.168.4.20:9113']

  - job_name: 'cadvisor'
    static_configs:
    - targets: ['192.168.4.30:8080']

  - job_name: 'docker'
    static_configs:
    - targets: ['192.168.4.30:9323']

alerting:
  alertmanagers:
  - static_configs:
    - targets:
      - 192.168.4.10:9093

rule_files:
  - "rules/container.yml"
  - "rules/node.yml"
  - "rules/web-server.yml"
- Membuat SSL Key dan Certificate Signing Request.
/opt/prometheus-2.48.1.linux-amd64# sudo openssl genrsa -out /opt/prometheus-2.48.1.linux-amd64/prometheus.key 2048
/opt/prometheus-2.48.1.linux-amd64# sudo openssl req -new -key /opt/prometheus-2.48.1.linux-amd64/prometheus.key -out /opt/prometheus-2.48.1.linux-amd64/prometheus.csr
You are about to be asked to enter information that will be incorporated
into your certificate request.
What you are about to enter is what is called a Distinguished Name or a DN.
There are quite a few fields but you can leave some blank
For some fields there will be a default value,
If you enter '.', the field will be left blank.

Country Name (2 letter code) [AU]:ID
State or Province Name (full name) [Some-State]: South Kalimantan
Locality Name (eg, city) []:Banjarbaru
Organization Name (eg, company) [Internet Widgits Pty Ltd]:
Organizational Unit Name (eg, section) []:
Common Name (e.g. server FQDN or YOUR name) []:
Email Address []:

Please enter the following 'extra' attributes
to be sent with your certificate request
A challenge password []:
An optional company name []:
- Membuat SSL Self-Signed Certificate.
/opt/prometheus-2.48.1.linux-amd64# openssl x509 -req -days 365 -signkey prometheus.key -in prometheus.csr -out prometheus.crt -extfile <(echo "subjectAltName=IP:192.168.4.10" )

Certificate request self-signature ok
subject=C = ID, ST = South Kalimantan, L = Banjarbaru, O = Internet Widgits Pty Ltd
- Instalasi paket yang dibutuhkan untuk basic authentication.
~# sudo apt-get update && sudo apt install apache2-utils -y
- Membuat password untuk basic authentication.
~# htpasswd -nBC 12 "" | tr -d ':\n'
New password: <inputYourPassword>
Re-type new password: <inputYourPassword>

$2y$12$<saltAndHash>
- Menambahkan konfigurasi untuk web agar SSL dan basic authentication diterapkan.
/opt/prometheus-2.48.1. linux-amd64# vim web.yml
basic_auth_users:
rifkyards: $2y$12$<saltAndHash>
tls_server_config:
    cert_file: /opt/prometheus-2.48.1.linux-amd64/prometheus.crt
    key_file: /opt/prometheus-2.48.1.linux-amd64/prometheus.key
- Menambahkan rules untuk mengirimkan alert node yang mati ke Alert Manager.
/opt/prometheus-2.48.1.linux-amd64# vim rules/node.yml
# Add this lines
groups:
  - name: NodeStatus
    rules:
      - alert: "NodeMonitoringDown"
        expr: up{instance="192.168.4.10:9100"} == 0
        for: 5m
        labels:
          severity: critical
          instance: "{{ $labels.instance }}"
          alertname: "NodeMonitoringDown"
        annotations:
          title: "{{ $labels.instance }} is down"
          description: "The server with IP {{ $labels.instance }} has been down for more than 5 minutes."

      - alert: "NodeClient1Down"
        expr: up{instance="192.168.4.10:9100"} == 0
        for: 5m
        labels:
          severity: critical
          instance: "{{ $labels.instance }}"
          alertname: NodeClient1Down
        annotations:
          title: "{{ $labels.name }} is down"
          description: "The server with IP {{ $labels.instance }} has been down for more than 5 minutes."

      - alert: "NodeClient2Down"
        expr: up{instance="192.168.4.30:9100"} == 0
        for: 5m
        labels:
          severity: critical
          instance: "{{ $labels.instance }}"
          alertname: NodeClient2Down
        annotations:
          title: "{{ $labels.instance }} is down"
          description: "The server with IP {{ $labels.instance }} has been down for more than 5 minutes."
- Menambahkan rules untuk mengirimkan alert Nginx Server yang mati ke Alert Manager.
/opt/prometheus-2.48.1.linux-amd64# vim rules/web-server.yml
# Add this lines
groups:
  - name: WebNginxStatus
    rules:
      - alert: NginxDown
        expr: nginx_up{instance="192.168.4.20:9113", job="nginx"} == 0
        for: 5m
        labels:
          severity: critical
          instance: "{{ $labels.instance }}"
          alertname: NginxDown
        annotations:
          title: "{{ $labels.name }} is down"
          description: "The {{ $labels.job }} server on {{ $labels.instance }} has been down for more than 5 minutes."
- Menambahkan rules untuk mengirimkan alert container yang mati ke Alert Manager.
/opt/prometheus-2.48.1.linux-amd64# vim rules/container.yml
# Add this lines
groups:
  - name: containerMonitoring
    rules:
      - alert: "Container2048Down"
        expr: absent(container_start_time_seconds{name="2048-apps",instance="192.168.4.30:8080"})
        for: 5m
        labels:
          severity: critical
          instance: "{{ $labels.instance }}"
          alertname: Container2048Down
        annotations:
          title: "{{ $labels.name }} is down"
          description: "The {{ $labels.name }} container on {{ $labels.instance }} has been down for more than 5 minutes."

      - alert: "ContainerTicTacToeDown"
        expr: absent(container_start_time_seconds{name="tic-tac-toe-apps",instance="192.168.4.30:8080"})
        for: 5m
        labels:
          severity: critical
          instance: "{{ $labels.instance }}"
          alertname: ContainerTicTacToeDown
        annotations:
          title: "{{ $labels.name }} is down"
          description: "The {{ $labels.name }} container on {{ $labels.instance }} has been down for more than 5 minutes."

      - alert: "GeneralContainerDown"
        expr: time() - container_last_seen{instance="192.168.4.30:8080", image!="", name!~"2048-apps|tic-tac-toe-apps|cadvisor"} > 220
        for: 20s
        labels:
          severity: critical
          instance: "{{ $labels.instance }}"
          alertname: GeneralContainerDown
          resolved: 'false'
        annotations:
          title: "{{ $labels.name }} is down"
          description: "A container {{ $labels.name }} on {{ $labels.instance }} has been down for more than 5 minutes."
- Menambahkan konfigurasi untuk Prometheus berjalan di SystemD.
~# vim /etc/systemd/system/prometheus_server.service
# Add this lines
[Unit]
Description=Prometheus Server

[Service]
User=root
ExecStart=/opt/prometheus-2.48.1.linux-amd64/prometheus --config.file=/opt/prometheus-2.48.1.linux-amd64/config.yml --web.config.file=/opt/prometheus-2.48.1.linux-amd64/web.yml --web.external-url=https://192.168.4.10:9090/

[Install]
WantedBy=default.target
- Menjalankan perintah agar SystemD Prometheus berjalan.
~# systemctl daemon-reload
~# systemctl start prometheus_server
~# systemctl enable prometheus_server
Instalasi dan Konfigurasi Tools Alert Manager.
Note : Lakukan langkah dibawah ini di monitoring node.
- Download dan ekstrak file Alert Manager.
~$ sudo su -
~# cd /opt
/opt# wget https://github.com/prometheus/alertmanager/releases/download/v0.26.0/alertmanager-0.26.0.linux-amd64.tar.gz
/opt# tar xvfz alertmanager-0.26.0.linux-amd64.tar.gz
Sebelum itu, karena Alert Manager perlu adanva akses ke email yang akan disetting dan juga bot pada platform Telegram.
- Untuk akses ke email, bisa menggunakan password dari email atau bisa pakai “App Password”. Berikut panduan yang bisa penulis kasih untuk pembuatan “App Password” :
- Untuk platform Telegram, bisa membuat bot dan Alert Manager akan memakai kredensial dari bot yang dibuat. Berikut panduan yang bisa penulis kasih untuk pembuatan bot di Telegram :
Menambahkan konfigurasi untuk Alert Manager.
/opt# cd alertmanager-0.26.0.linux-amd64
/opt/alertmanager-0.26.0.linux-amd64# vim config.yml
# Add this lines
global:
  resolve_timeout: 5m

route:
  group_by: ['Alertname']
  receiver: combined-receiver

  routes:
    - match:
        resolved: "false"
      receiver: combined-receiver-no-resolved

    - receiver: combined-receiver

receivers:
- name: combined-receiver
  email_configs:
  - to: "<yourEmail>@gmail.com"
    from: "<yourEmail>@gmail.com"
    smarthost: smtp.gmail.com:587
    auth_username: "<yourEmail>@gmail.com"
    auth_identity: "<yourEmail>@gmail.com"
    auth_password: "xxxx xxxx xxxx"
    send_resolved: True
    headers:
      subject: '{{ template "__subject" . }}'
    html: '{{ template "email.custom.html" . }}'

  telegram_configs:
  - api_url: https://api.telegram.org
    bot_token: "<yourBotToken>"
    chat_id: <yourChatID>
    send_resolved: True
    message: '{{ template "telegram.message" . }}'

- name: combined-receiver-no-resolved
  email_configs:
  - to: "<yourEmail>@gmail.com"
    from: "<yourEmail>@gmail.com"
    smarthost: smtp.gmail.com:587
    auth_username: "<yourEmail>@gmail.com"
    auth_identity: "<yourEmail>@gmail.com"
    auth_password: "xxxx xxxx xxxx"
    send_resolved: False
    headers:
      subject: '{{ template "__subject" . }}'
    html: '{{ template "email.custom.html" . }}'

  telegram_configs:
  - api_url: https://api.telegram.org
    bot_token: "<yourBotToken>"
    chat_id: <yourChatID>
    send_resolved: False
    message: '{{ template "telegram.message" . }}'

templates:
- 'templates/telegram.tmpl'
- 'templates/email.tmpl'
- Menambahkan file template untuk telegram.
/opt/alertmanager-0.26.0.linux-amd64# vim template/telegram.tmpl
# Add this lines
{{ define "telegram.message" }}
{{ if eq .Status "firing" }}
{{ if eq .CommonLabels.severity "critical" }}🔴 Alert: {{ .CommonLabels.alertname }}
{{ else if eq .CommonLabels.severity "warning" }}🟠 Alert: {{ .CommonLabels.alertname }}
{{ else }}⚪️ Alert: {{ .CommonLabels.alertname }}
{{ end }}
Status: 🔥 FIRING
Severity: {{ if eq .CommonLabels.severity "critical" }}🔴 {{ .CommonLabels.severity | title }}{{ else if eq .CommonLabels.severity "warning" }}🟠 {{ .CommonLabels.severity | title }}{{ else }}⚪️ {{ .CommonLabels.severity | title }}{{ end }}
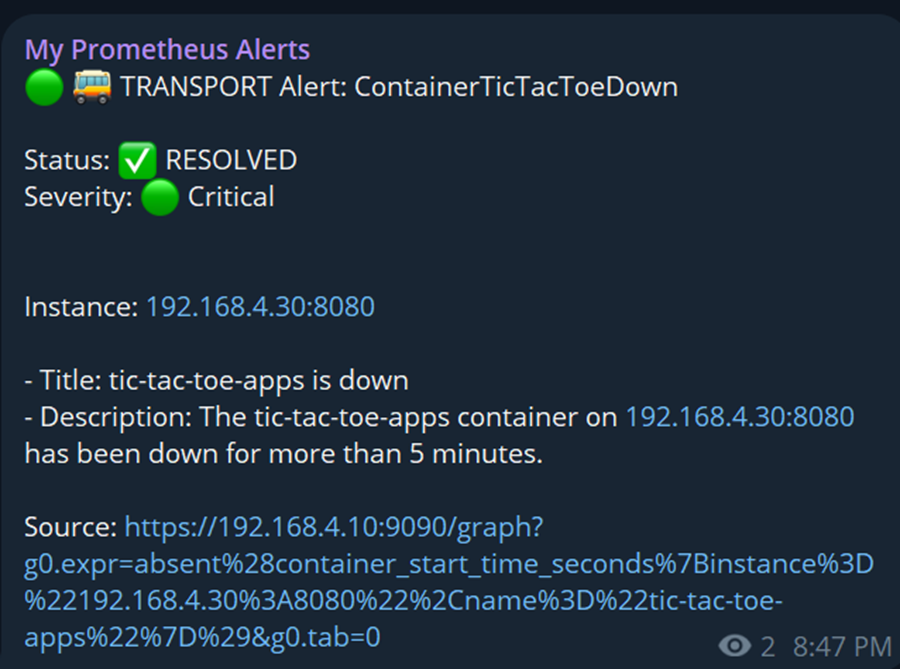
{{ else if eq .Status "resolved" }}
{{ if eq .CommonLabels.severity "critical" }}🟢 🚌 TRANSPORT Alert: {{ .CommonLabels.alertname }}
{{ else if eq .CommonLabels.severity "warning" }}🟢 🚌 TRANSPORT Alert: {{ .CommonLabels.alertname }}
{{ else }}⚪️ Alert: {{ .CommonLabels.alertname }}
{{ end }}
Status: ✅ RESOLVED
Severity: {{ if eq .CommonLabels.severity "critical" }}🟢 {{ .CommonLabels.severity | title }}{{ else if eq .CommonLabels.severity "warning" }}🟢 {{ .CommonLabels.severity | title }}{{ else }}⚪️ {{ .CommonLabels.severity | title }}{{ end }}
{{ end }}
{{ range .Alerts }}
Instance: {{ .Labels.instance }}
- Title: {{ .Annotations.title }}
- Description: {{ .Annotations.description }}
Source: {{ .GeneratorURL | reReplaceAll "&g0.tab=1$" "&g0.tab=0" }}
{{ end }}
{{ end }}
- Menambahkan file template untuk email.
/opt/alertmanager-0.26.0.linux-amd64# vim template/email.tmpl
{{ define "__subject" }}
  {{ if and .Alerts.Firing .Alerts.Resolved }}
    [INFO - Firing: {{ len .Alerts.Firing }} - Resolved: {{ len .Alerts.Resolved }}]
  {{ else if eq .Status "firing" }}
    [FIRING: {{ if .Alerts.Firing }}{{ len .Alerts.Firing }}{{ else }}0{{ end }} - {{ if eq (len .Alerts.Firing) 1 }}{{ .CommonLabels.alertname }} - {{ .CommonLabels.instance }} - {{ .CommonLabels.severity | title }}{{ else }}Many Alerts{{ end }}]
  {{ else if eq .Status "resolved" }}
    [RESOLVED: {{ if .Alerts.Resolved }}{{ len .Alerts.Resolved }}{{ else }}0{{ end }} - {{ if eq (len .Alerts.Resolved) 1 }}{{ .CommonLabels.alertname }}{{ else }}Many Alerts{{ end }}]
  {{ else }}
    [UNKNOWN]
  {{ end }}
{{ end }}

{{ define "email.custom.html" }}
<!DOCTYPE html>
<html xmlns="http://www.w3.org/1999/xhtml">
<head>
  <meta name="viewport" content="width=device-width" />
  <meta http-equiv="Content-Type" content="text/html; charset=UTF-8" />
  <title>{{ template "__subject" . }}</title>
  <style>
    body {
      font-family: Arial, sans-serif;
      color: #333;
    }
    h1 {
      color: #d9534f; /* Red color for headings */
    }
    .alert-table {
      width: 100%;
      border-collapse: collapse;
      margin-top: 20px;
    }
    .alert-table th, .alert-table td {
      padding: 10px;
      border: 1px solid #ddd;
    }
    .alert-table th {
      background-color: #f9f9f9;
    }
    .alert-table tr:nth-child(even) {
      background-color: #f2f2f2;
    }
    .alert-table td a {
      color: #007bff;
      text-decoration: none;
    }
    .alert-table td a:hover {
      text-decoration: underline;
    }
  </style>
</head>

<body>

  <p>Dear Team,</p>

  <p>Total Resolved Alerts: {{ .Alerts.Resolved | len }}</p>

  <h2>Firing Alerts</h2>
  {{ if gt (len .Alerts.Firing) 0 }}
  <table class="alert-table">
    <tr>
      <th>Instance</th>
      <th>Severity</th>
      <th>Description</th>
      <th>Source</th>
    </tr>
    {{ range .Alerts.Firing }}
    <tr>
      <td>{{ .Labels.instance }}</td>
      <td>{{ .Labels.severity }}</td>
      <td>{{ if .Annotations.description }}{{ .Annotations.description }}{{ else }}N/A{{ end }}</td>
      <td><a href="{{ .GeneratorURL }}">Source</a></td>
    </tr>
    {{ end }}
  </table>
  {{ else }}
  <p>No active firing alerts.</p>
  {{ end }}

  <h2>Resolved Alerts</h2>
  {{ if gt (len .Alerts.Resolved) 0 }}
  <table class="alert-table">
    <tr>
      <th>Instance</th>
      <th>Severity</th>
      <th>Description</th>
      <th>Source</th>
    </tr>
    {{ range .Alerts.Resolved }}
    <tr>
      <td>{{ .Labels.instance }}</td>
      <td>{{ .Labels.severity }}</td>
      <td>{{ if .Annotations.description }}{{ .Annotations.description }}{{ else }}N/A{{ end }}</td>
      <td><a href="{{ .GeneratorURL }}">Source</a></td>
    </tr>
    {{ end }}
  </table>
  {{ else }}
  <p>No resolved alerts.</p>
  {{ end }}

  <p>Best regards,<br>Monitoring System</p>

</body>
</html>
{{ end }}
- Menambahkan konfigurasi untuk Alert Manager berjalan di SystemD.
/opt/alertmanager-0.26.0.linux-amd64# vim /etc/systemd/system/alert_manager.service
[Unit]
Description=Alert Manager

[Service]
User=root
ExecStart=/opt/alertmanager-0.26.0.linux-amd64/alertmanager --config.file=/opt/alertmanager-0.26.0.linux-amd64/config.yml --web.external-url=http://192.168.4.10:9093/ --log.level=debug

[Install]
WantedBy=default.target
- Menjalankan perintah agar SystemD Alert Manager berjalan.
~# systemctl daemon-reload
~# systemctl start alert_manager
~# systemctl enable alert_manager
Instalasi dan Konfigurasi Tools Grafana.
Note : Lakukan langkah dibawah ini di monitoring node.
- Download dan ekstrak file Grafana.
~$ sudo su -
~# cd /opt
~# wget https://dl.grafana.com/oss/release/grafana-10.2.2.linux-amd64.tar.gz
~# tar -zxvf grafana-10.2.2.linux-amd64.tar.gz
- Membuat SSL Key.
/opt# cd grafana-v10.2.2
/opt/grafana-v10.2.2# sudo openssl genrsa -out /opt/grafana-v10.2.2/grafana.key 2048
- Membuat SSL Certificate Signing Request.
/opt/grafana-v10.2.2# sudo openssl req -new -key /opt/grafana-v10.2.2/grafana.key -out /opt/grafana-v10.2.2/grafana.csr
You are about to be asked to enter information that will be incorporated
into your certificate request.
What you are about to enter is what is called a Distinguished Name or a DN.
There are quite a few fields but you can leave some blank
For some fields there will be a default value,
If you enter '.', the field will be left blank.

Country Name (2 letter code) [AU]:ID
State or Province Name (full name) [Some-State]: South Kalimantan
Locality Name (eg, city) []:Banjarbaru
Organization Name (eg, company) [Internet Widgits Pty Ltd]:
Organizational Unit Name (eg, section) []:
Common Name (e.g. server FQDN or YOUR name) []:
Email Address []:

Please enter the following 'extra' attributes
to be sent with your certificate request
A challenge password []:
An optional company name []:
- Membuat SSL Self-Signed Certificate.
/opt/grafana-v10.2.2# sudo openssl x509 -req -days 365 -in /opt/grafana-v10.2.2/grafana.csr -signkey /opt/grafana-v10.2.2/grafana.key -out /opt/grafana-v10.2.2/grafana.crt

Certificate request self-signature ok
subject=C = ID, ST = South Kalimantan, L = Banjarbaru, O = Internet Widgits Pty Ltd
- Konfigurasi untuk menerapkan SSL.
/opt/grafana-v10.2.2# vim config.ini
# Add this lines
[server]
http_addr = 192.168.4.10
http_port = 3000
root_url = https://192.168.4.10:3000
cert_key = /opt/grafana-v10.2.2/grafana.key
cert_file = /opt/grafana-v10.2.2/grafana.crt
enforce_domain = False
protocol = https
- Konfigurasi untuk Grafana berjalan di SystemD.
/opt/grafana-v10.2.2# vim /etc/systemd/system/grafana.service
# Add this lines
[Unit]
Description=Grafana

[Service]
User=root
ExecStart=/opt/grafana-v10.2.2/bin/grafana-server --config /opt/grafana-v10.2.2/config.ini -homepath /opt/grafana-v10.2.2/ web

[Install]
WantedBy=default.target
- Menjalankan perintah agar SystemD Grafana berjalan.
~# systemctl daemon-reload
~# systemctl start grafana
~# systemctl enable grafana
Setting Grafana Dashboard.
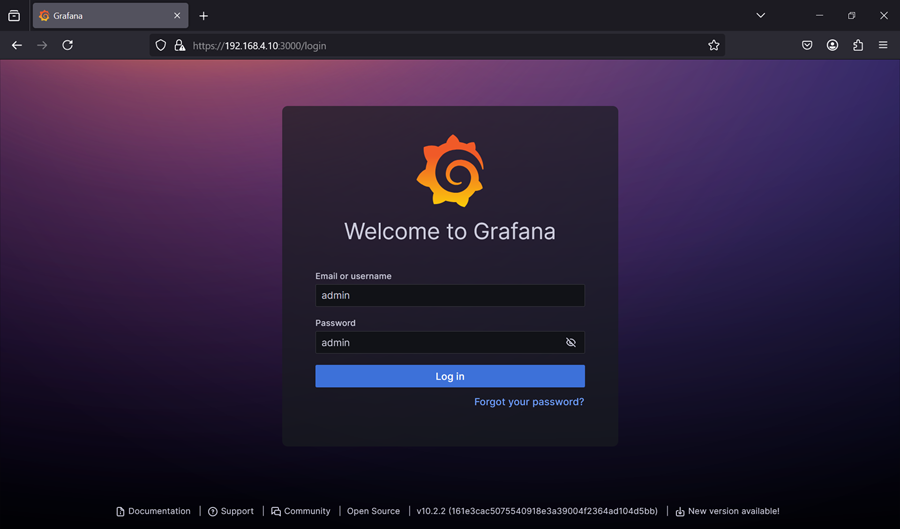
Akses dashboard grafana di https://192.168.4.10:3000 dengan default user dan password. Karena SSL Self-Signed, bisa di “Accept the Risk and Continue”.
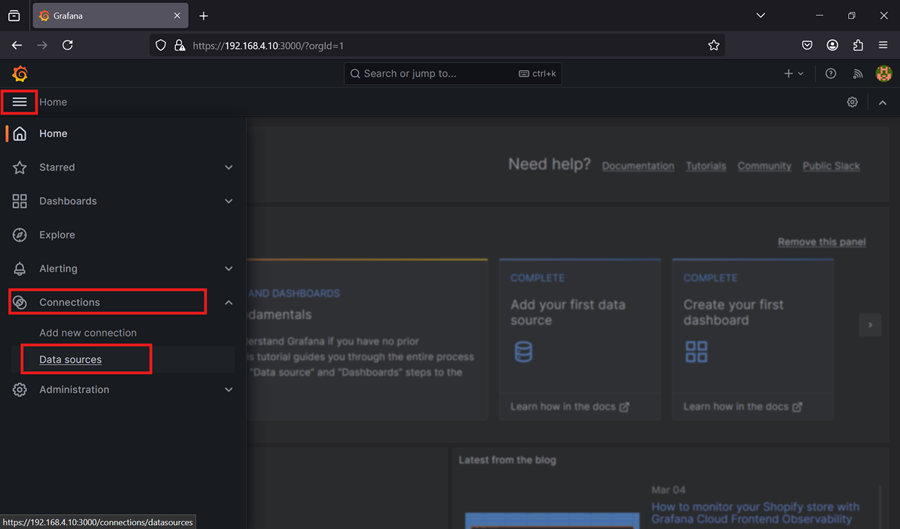
Integrasi Prometheus dengan Grafana, dengan mengakses garis tiga dipojok kiri > “Connections” > “Data Sources”.
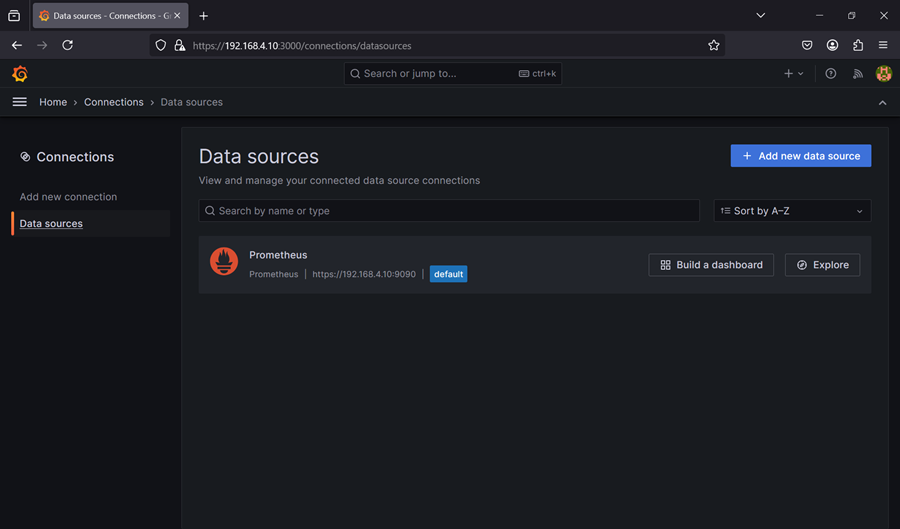
Setelah masuk di “Data Sources”, bisa tambahkan kita tambahkan “Data Sources” untuk integrasi dengan Prometheus. Bisa di klik “Add new data source”.
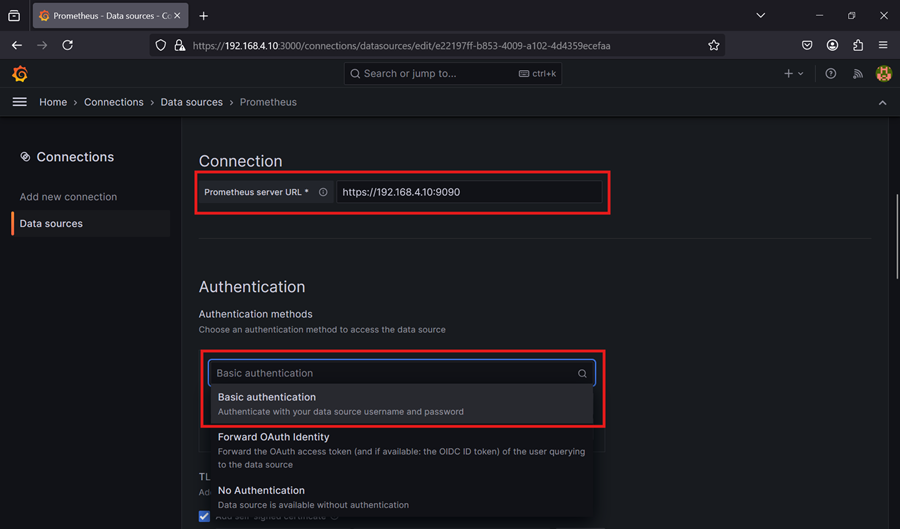
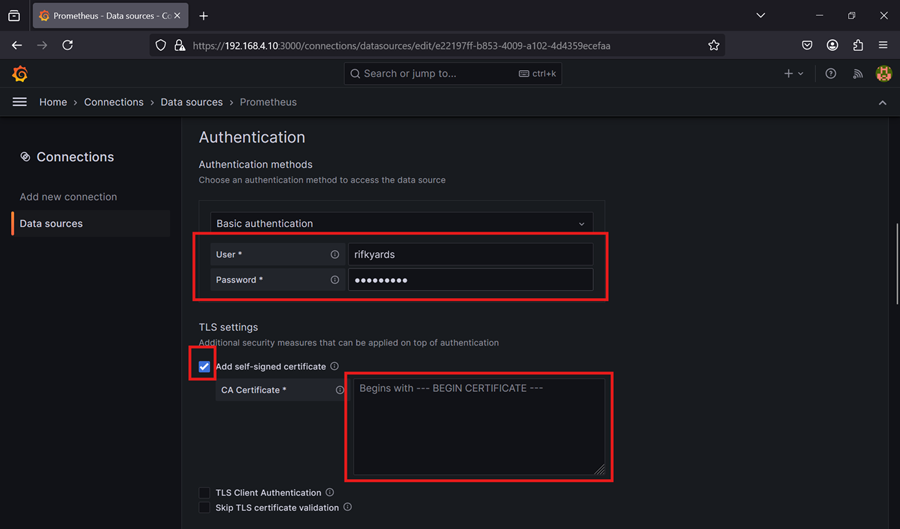
Menambahkan endpoint dan basic authentication untuk Prometheus.
Sebelum itu, kita dapatkan isi konten dari Self-Signed certificate Prometheus terlebih dahulu.
/opt/prometheus-2.48.1.linux-amd64# cat prometheus.crt
-----BEGIN CERTIFICATE-----
XXXXXXXXXXXXXXXXXXXXXXXXXXXX
XXXXXxXXXXXXXXXXXXXXXXXXXXXX
-----END CERTIFICATE------
Isi identitas user dan password yang kita buat untuk Prometheus, dan juga isi Self-Signed Certificate dengan isi konten dari file “prometheus.crt”.
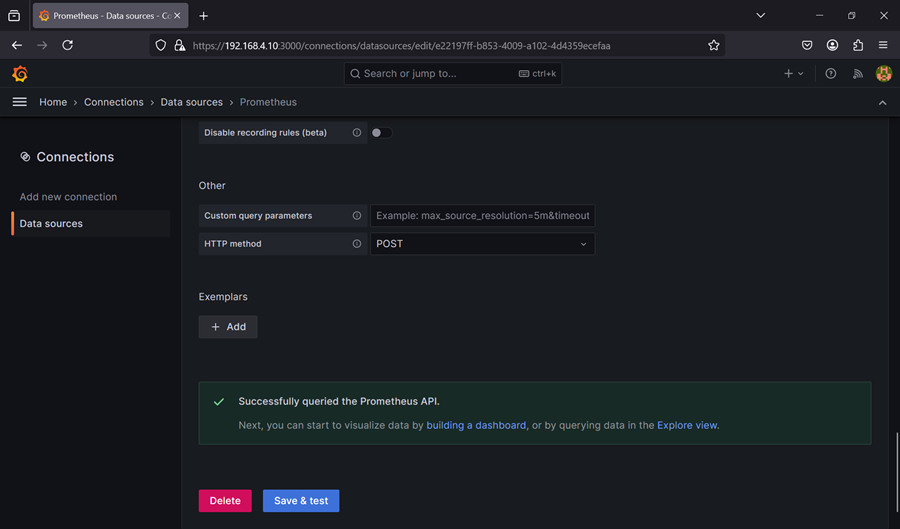
Scroll hingga paling bawah, bisa di klik “Save & test”. Jika berhasil akan muncul “Successfully queried the Prometheus API”.
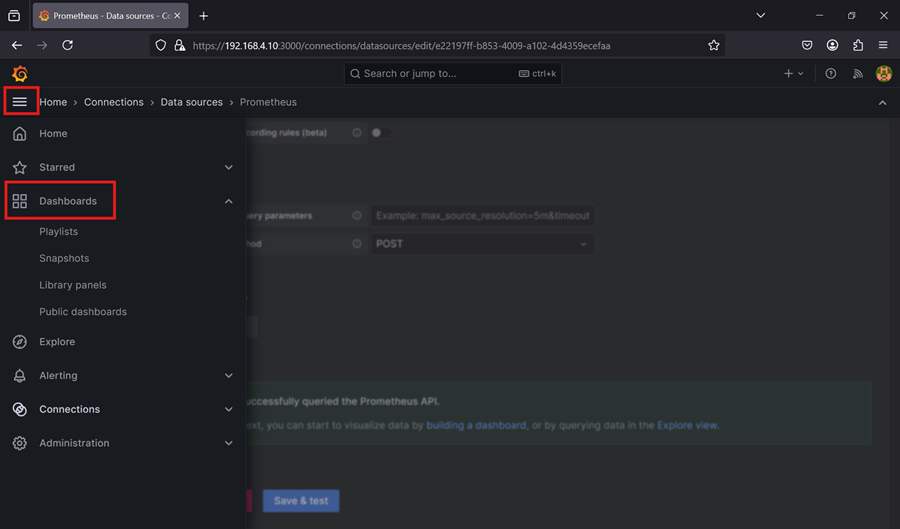
Setelah integrasi Grafana dan Prometheus, barulah kita buat dashboard untuk monitoring metrics. Klik garis tiga dipojok kiri > “Dashboards”.
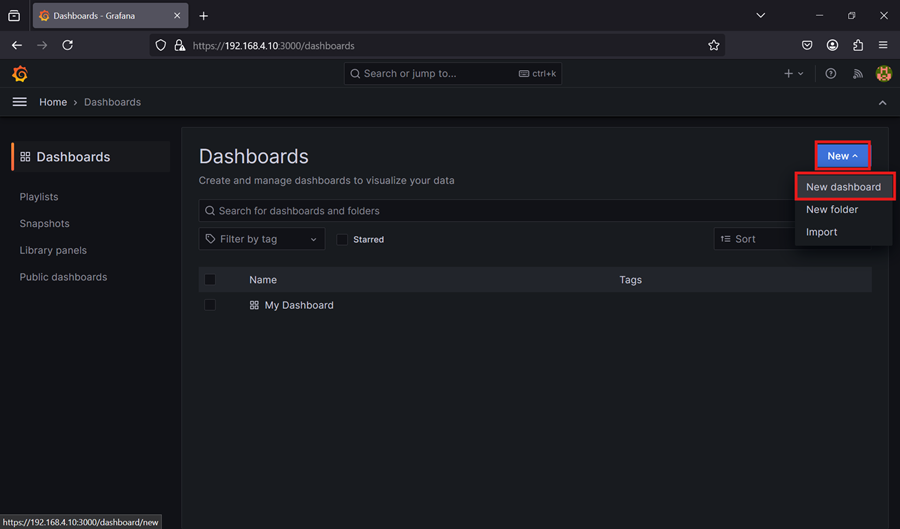
Setelah masuk pada halaman Dashboards, klik “New” > “New Dashboards”.
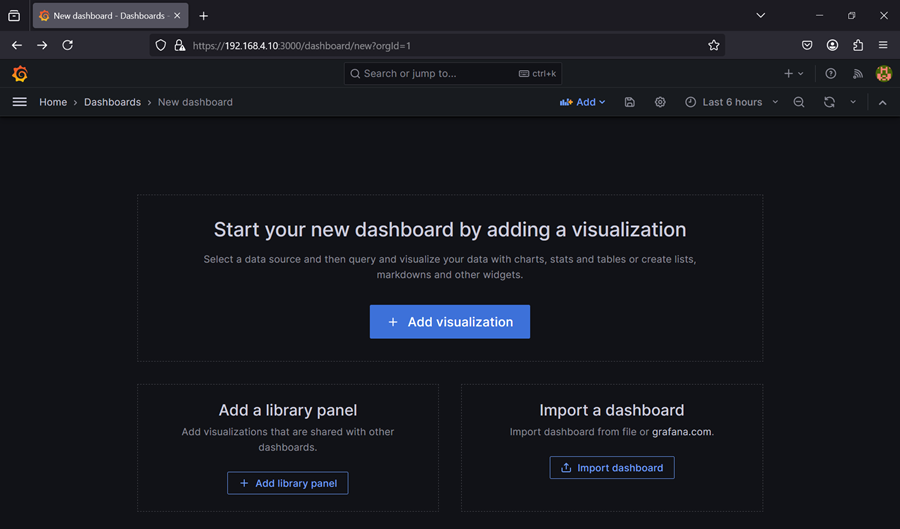
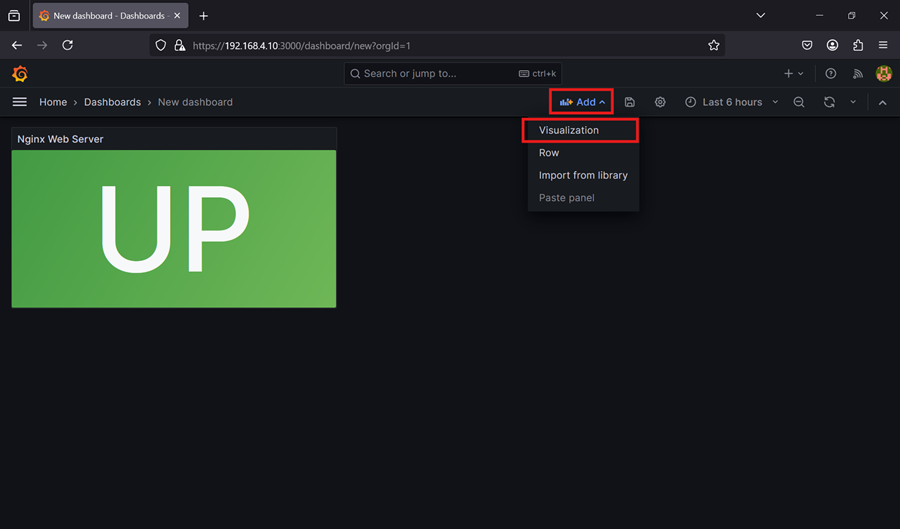
Saat masuk pada halaman pembuatan dashboard, klik “Add visualization”.
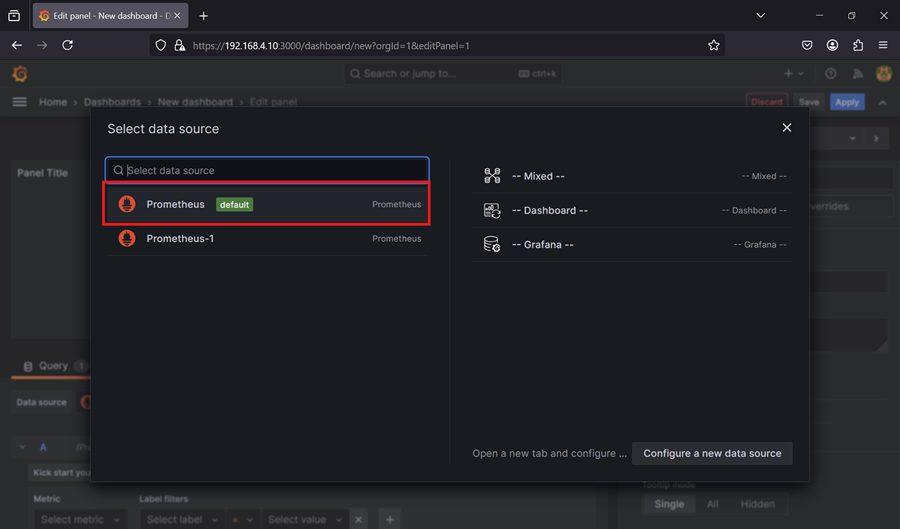
Lalu pilih Prometheus yang dibuat sebelumnya sebagai data sources.
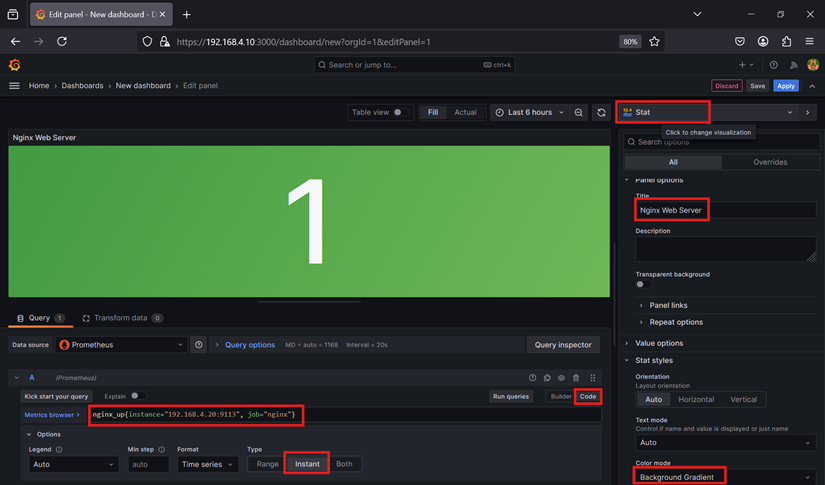
Saatnya membuat dashboard panel yang pertama, untuk menjawab pertanyaan “Apakah Nginx web server kita nyala atau mati?”.
Menambahkan query :
nginx_up{instance="192.168.4.20:9113", job="nginx"}
Lalu mengubah visualiasasi menjadi “Stat”, mengubah nama panel, dan mengubah “Color Mode”.
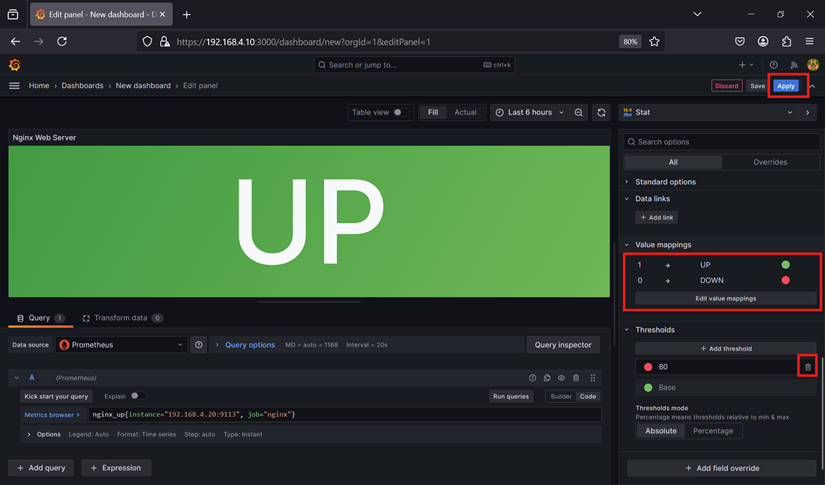
Menambahkan “Value mappings” agar mengubah data menjadi UP or DOWN, dan hapus untuk “Thresholds” dengan nilai 80. Dan klik “Apply” untuk menerapkan konfigurasi panel.
Untuk menambahkan panel baru, bisa klik “Add” > “Visualization”.
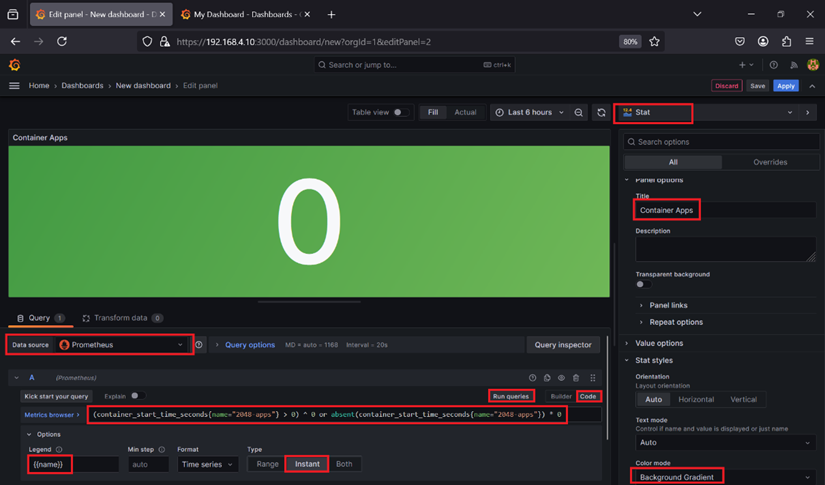
Selanjutnya membuat dashboard panel untuk menjawab pertanyaan “Apakah aplikasi container kita nyala atau mati?”.
Menambahkan query :
(container_start_time_seconds{name="2048-apps"} > 0) ^ 0 or absent(container_start_time_seconds{name="2048-apps"}) * 0
Lalu mengubah visualisasi menjadi “Stat”, mengubah nama panel, dan mengubah “Color Mode”.
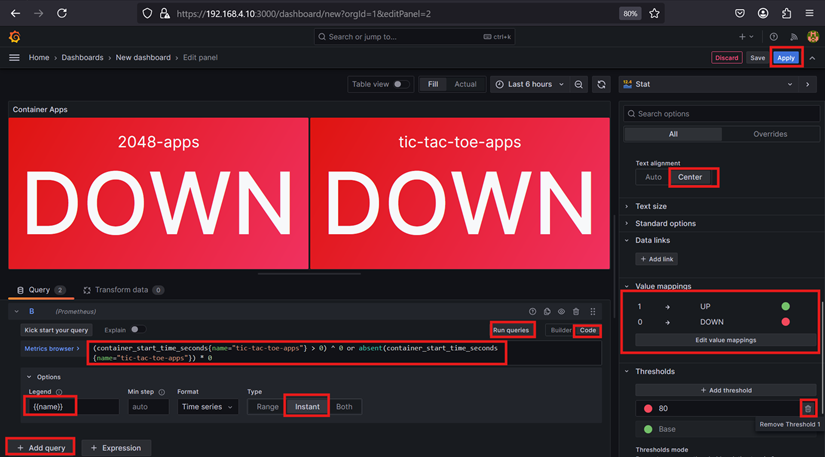
Klik “Add Query” untuk menambahkan query :
(container_start_time_seconds{name="tic-tac-toe-apps"} > 0) ^ 0 or absent(container_start_time_seconds{name="tic-tac-toe-apps"}) * 0
Lalu menambahkan “Value mappings” agar mengubah data menjadi UP or DOWN, dan hapus untuk “Thresholds” dengan nilai 80. Dan klik “Apply” untuk menerapkan setting.
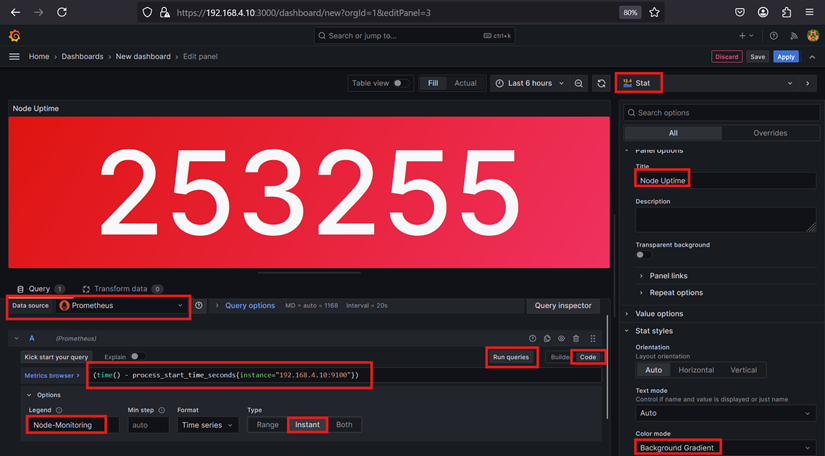
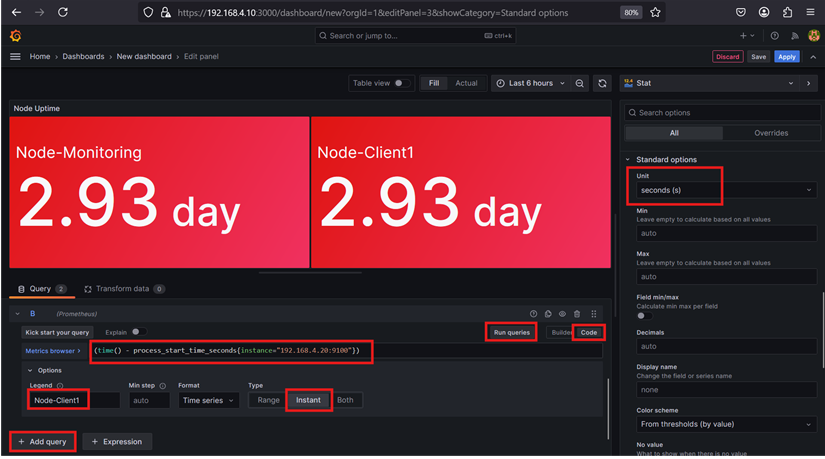
Selanjutnya membuat dashboard panel untuk menjawab pertanyaan “Berapa lama node sudah berjalan?”.
Menambahkan query :
(time() - process_start_time_seconds{instance="192.168.4.10:9100"})
Lalu mengubah visualisasi menjadi “Stat”, mengubah nama panel, dan mengubah “Color Mode”.
Klik “Add Query” untuk menambahkan query :
(time() - process_start_time_seconds{instance="192.168.4.20:9100"})
Lalu menganti “Unit” menjadi “seconds(s)”.
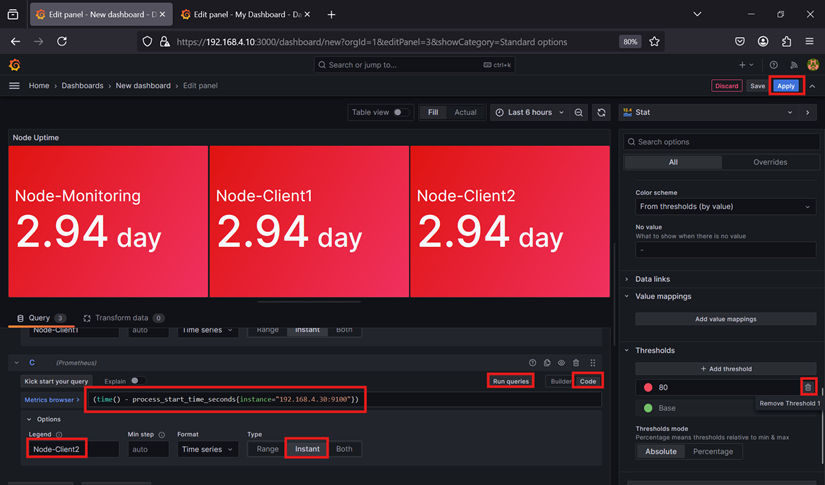
Klik “Add Query” untuk menambahkan query :
(time() - process_start_time_seconds{instance="192.168.4.30:9100"})
Lalu hapus untuk “Thresholds” dengan nilai 80. Dan klik “Apply” untuk menerapkan setting.
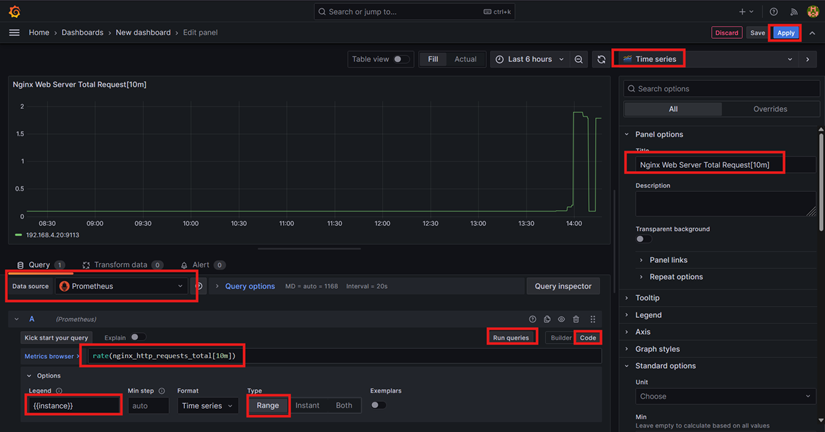
Selanjutnya membuat dashboard panel untuk menjawab pertanyaan “Berapa rata-rata request pada Nginx dalam kurun waktu 10 menit?”.
Menambahkan query :
rate(nginx_http_requests_total[10m])
Lalu mengubah nama panel. Lalu bisa juga untuk hapus “Thresholds” dengan nilai 80, dan klik “Apply” untuk menerapkan setting.
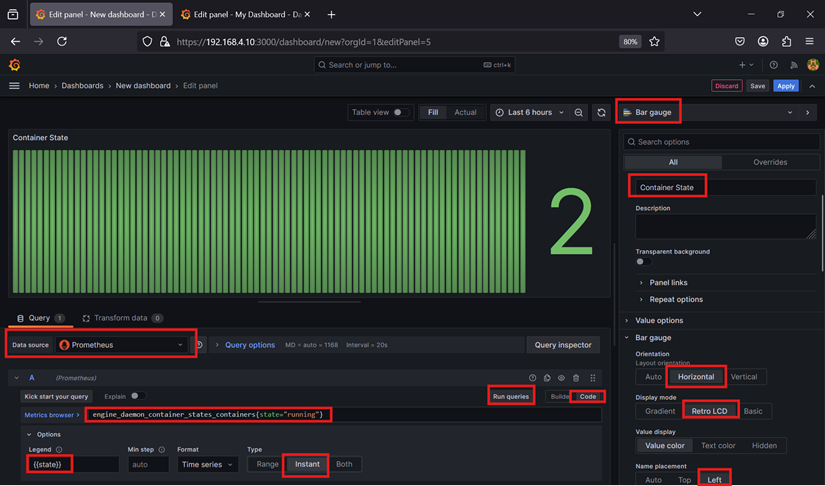
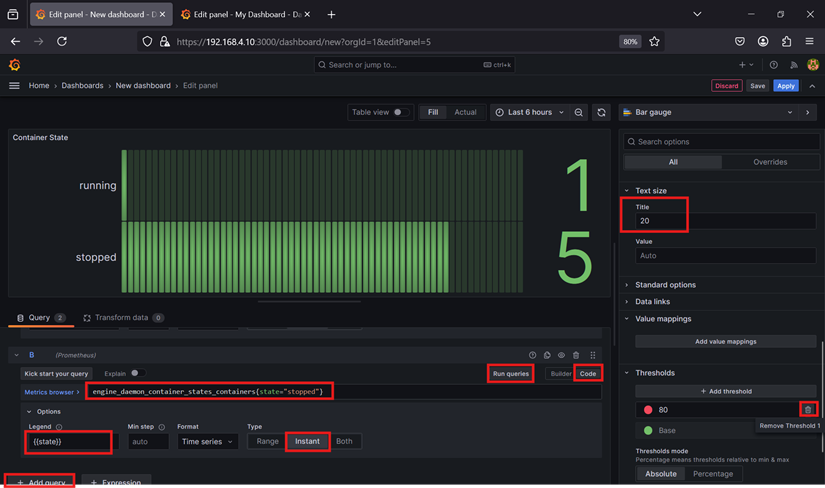
Selanjutnya membuat dashboard panel untuk menjawab pertanyaan “Berapa banyak container yang dipause, distop, maupun berjalan?”.
Menambahkan query :
engine_daemon_container_states_containers{state="running"}
Lalu mengubah visualisasi menjadi “Bar Gauge”, mengubah nama panel, dan mengubah “Orientation”, “Display mode”, dan “Name placement”.
Klik “Add Query” untuk menambahkan query :
engine_daemon_container_states_containers{state="stopped"}
Lalu menganti “Text size” pada “Title” menjadi 20 dan hapus “Thresholds”.
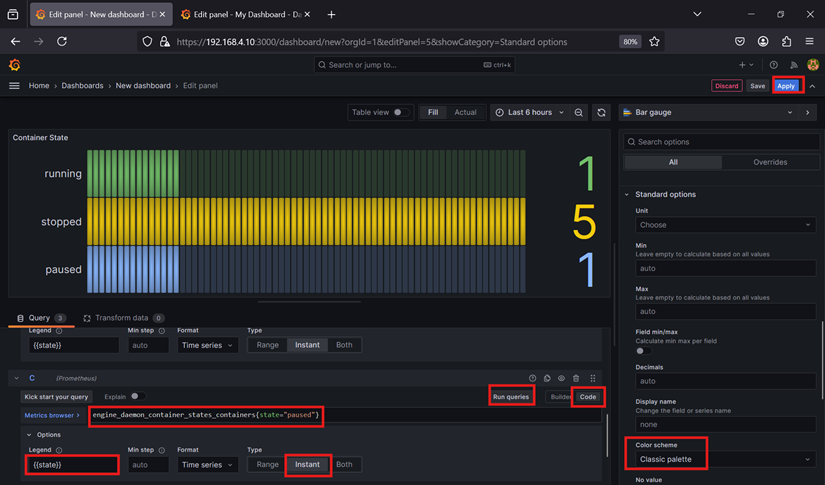
Klik “Add Query” untuk menambahkan query :
engine_daemon_container_states_containers{state="paused"}
Lalu mengganti “Color Scheme”. Lalu klik “Apply” untuk menerapkan setting.
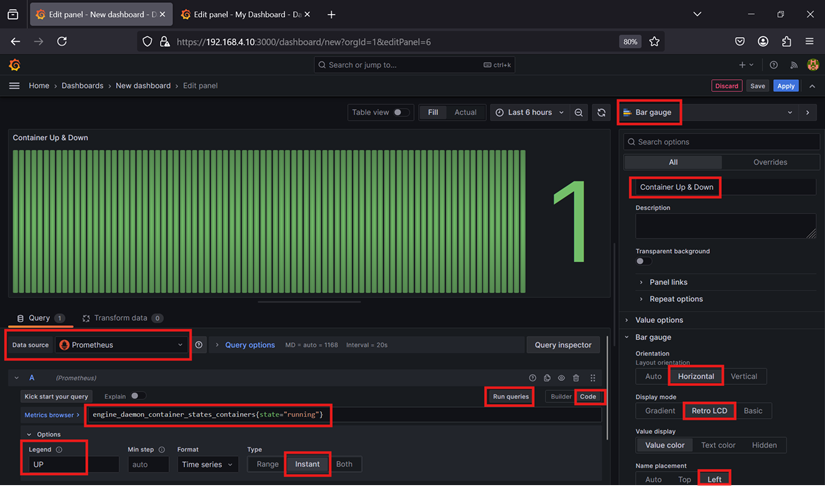
Selanjutnya membuat dashboard panel untuk menjawab pertanyaan “Berapa banyak container yang mati dan berjalan?”.
Menambahkan query :
engine_daemon_container_states_containers{state="running"}
Lalu mengubah visualisasi menjadi “Bar Gauge”, mengubah nama panel, dan mengubah “Orientation”, “Display mode”, dan “Name placement”.
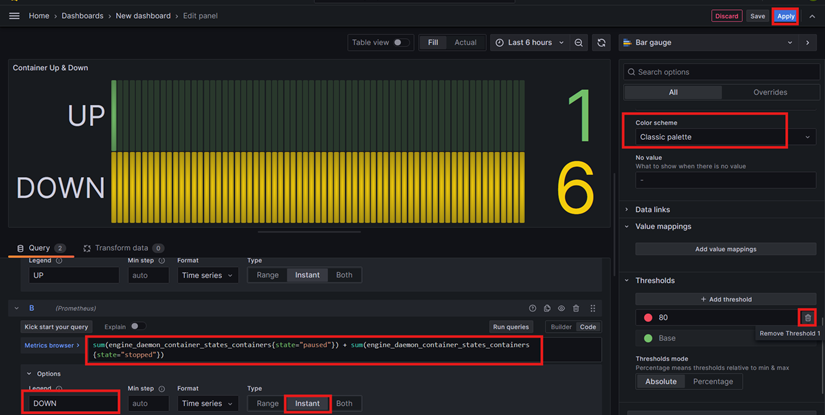
Klik “Add Query” untuk menambahkan query :
sum(engine_daemon_container_states_containers{state="paused"}) + sum(engine_daemon_container_states_containers{state="stopped"})
Lalu mengganti “Color Scheme” dan hapus “Thresholds”. Lalu klik “Apply” untuk menerapkan setting.
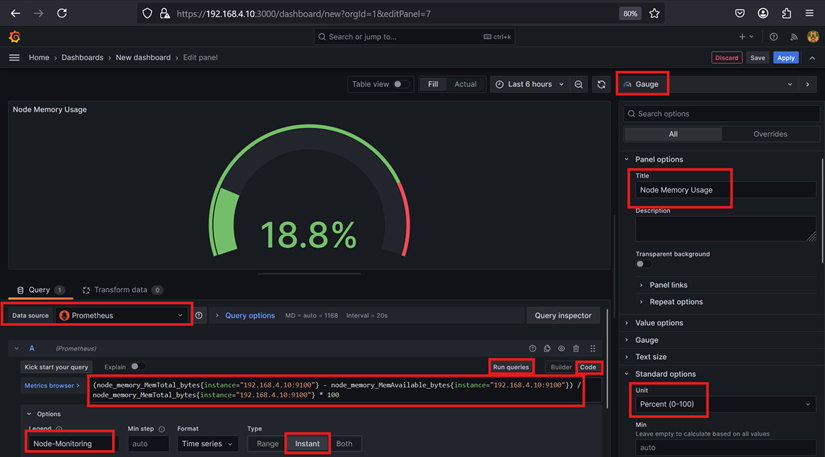
Selanjutnya membuat dashboard panel untuk menjawab pertanyaan “Berapa persen penggunaan memory pada tiap node?”.
Menambahkan query :
(node_memory_MemTotal_bytes{instance="192.168.4.10:9100"} - node_memory_MemAvailable_bytes{instance="192.168.4.10:9100"}) / node_memory_MemTotal_bytes{instance="192.168.4.10:9100"} * 100
Lalu Mengubah visualisasi menjadi “Gauge” dan menambahkan “Unit” dengan standar “Percent (0-100)”.
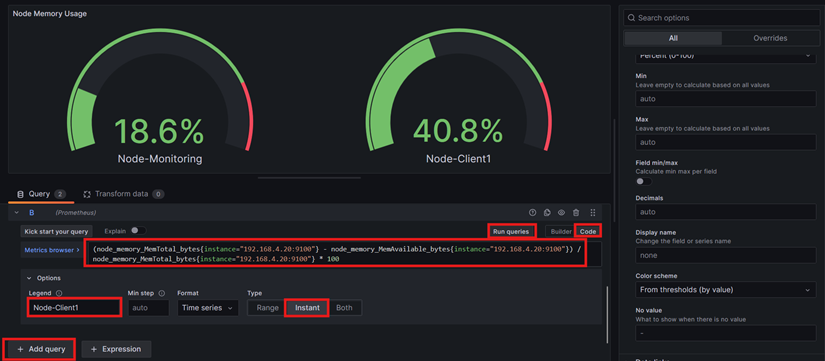
Klik “Add Query” untuk menambahkan query :
(node_memory_MemTotal_bytes{instance="192.168.4.20:9100"} - node_memory_MemAvailable_bytes{instance="192.168.4.20:9100"}) / node_memory_MemTotal_bytes{instance="192.168.4.20:9100"} * 100
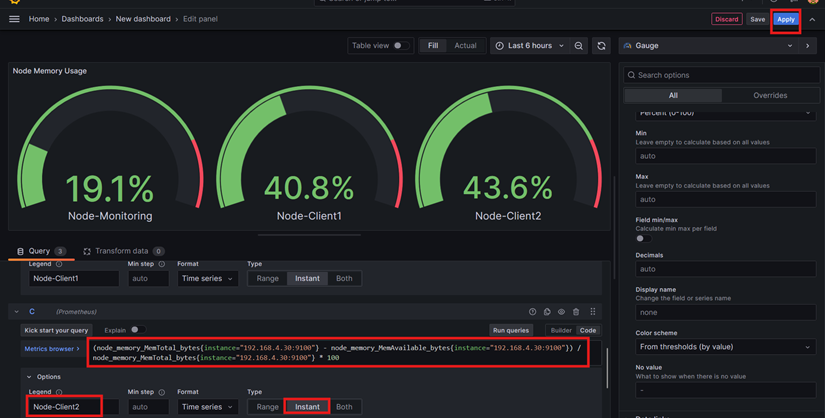
Klik “Add Query” untuk menambahkan query :
(node_memory_MemTotal_bytes{instance="192.168.4.30:9100"} - node_memory_MemAvailable_bytes{instance="192.168.4.30:9100"}) / node_memory_MemTotal_bytes{instance="192.168.4.30:9100"} * 100
Lalu klik “Apply” untuk menerapkan setting.
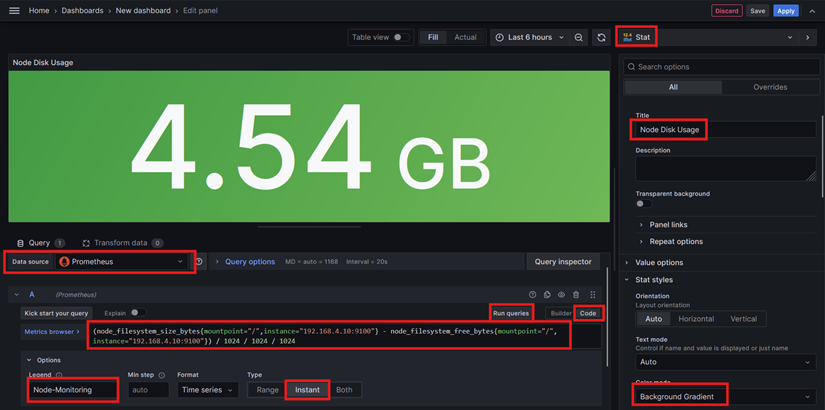
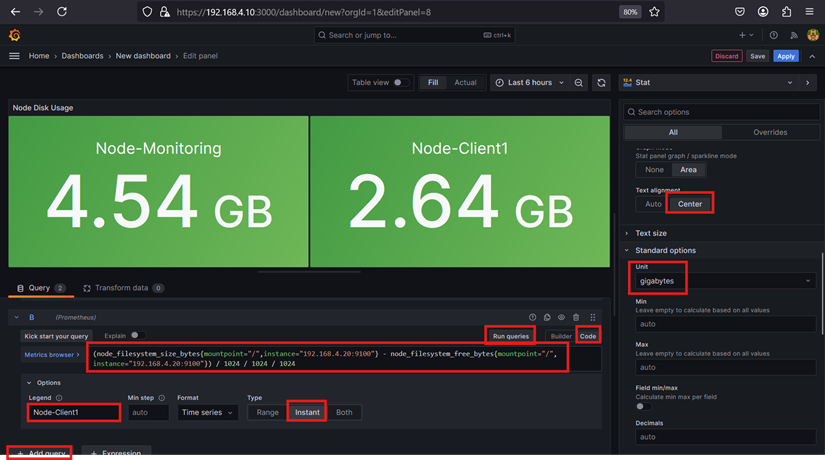
Selanjutnya membuat dashboard panel untuk menjawab pertanyaan “Berapa penggunaan disk pada tiap node?”.
Menambahkan query :
(node_filesystem_size_bytes{mountpoint="/",instance="192.168.4.10:9100"} - node_filesystem_free_bytes{mountpoint="/",instance="192.168.4.10:9100"}) / 1024 / 1024 / 1024
Lalu Mengubah visualisasi menjadi “Stat”, mengubah nama panel, dan mengubah “Color Mode”.
Klik “Add Query” untuk menambahkan query :
(node_filesystem_size_bytes{mountpoint="/",instance="192.168.4.20:9100"} - node_filesystem_free_bytes{mountpoint="/",instance="192.168.4.20:9100"}) / 1024 / 1024 / 1024
Lalu menambahkan “Unit” dengan standar “gigabytes”.
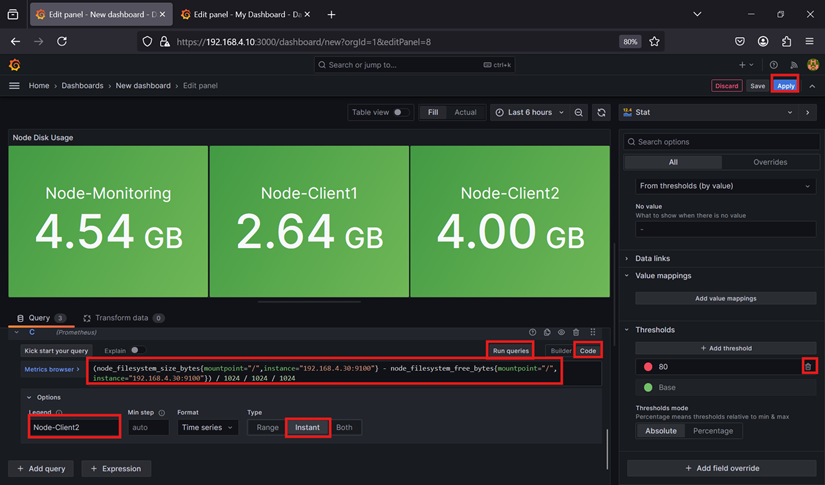
Klik “Add Query” untuk menambahkan query :
(node_filesystem_size_bytes{mountpoint="/",instance="192.168.4.30:9100"} - node_filesystem_free_bytes{mountpoint="/",instance="192.168.4.30:9100"}) / 1024 / 1024 / 1024
Lalu menghapus “Thresholds”, lalu klik “Apply”.
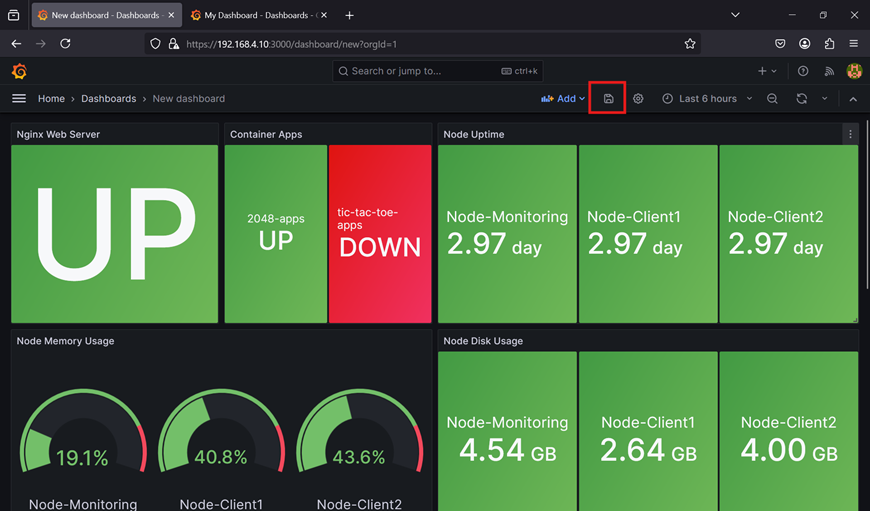
Lalu jika sudah mengatur panel, bisa di klik tombol save. Dan isikan nama dashboard dan klik “Save”.
Pengujian
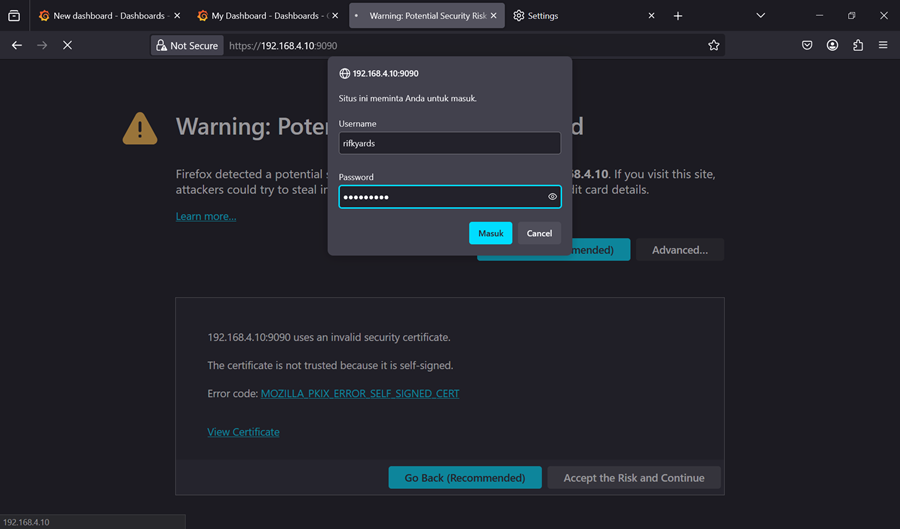
Prometheus dapat diakses pada URL https://192.168.4.10:9090 dan meminta input username dan password.
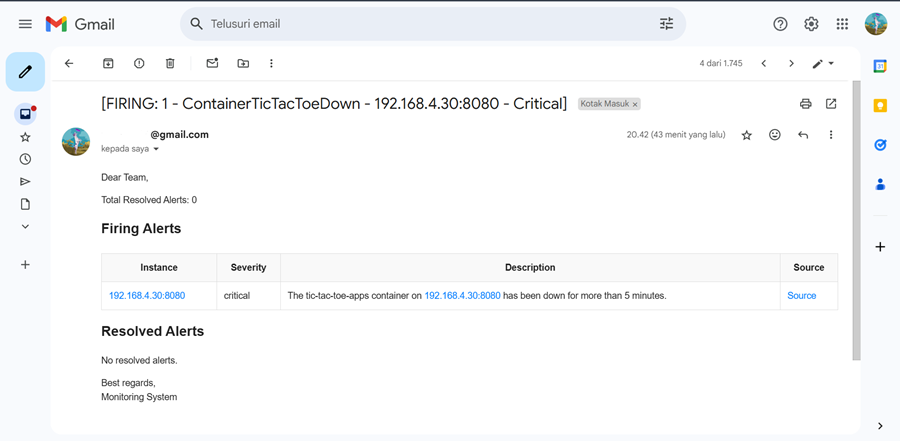
Cek email yang terkirim jika ada firing status.
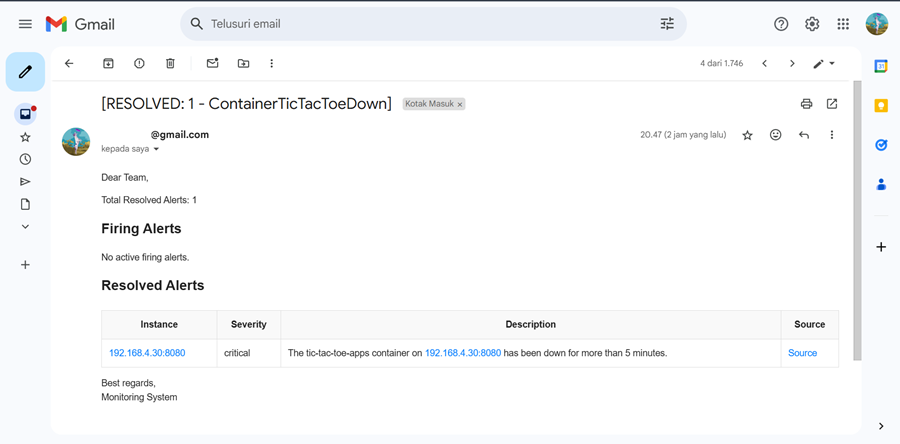
Cek email yang terkirim jika ada resolve status.
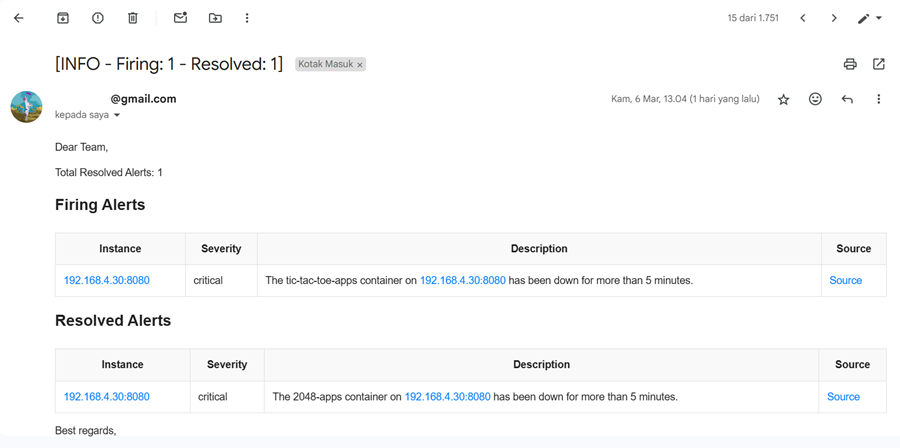
Cek email yang terkirim jika ada resolve dan firing status.
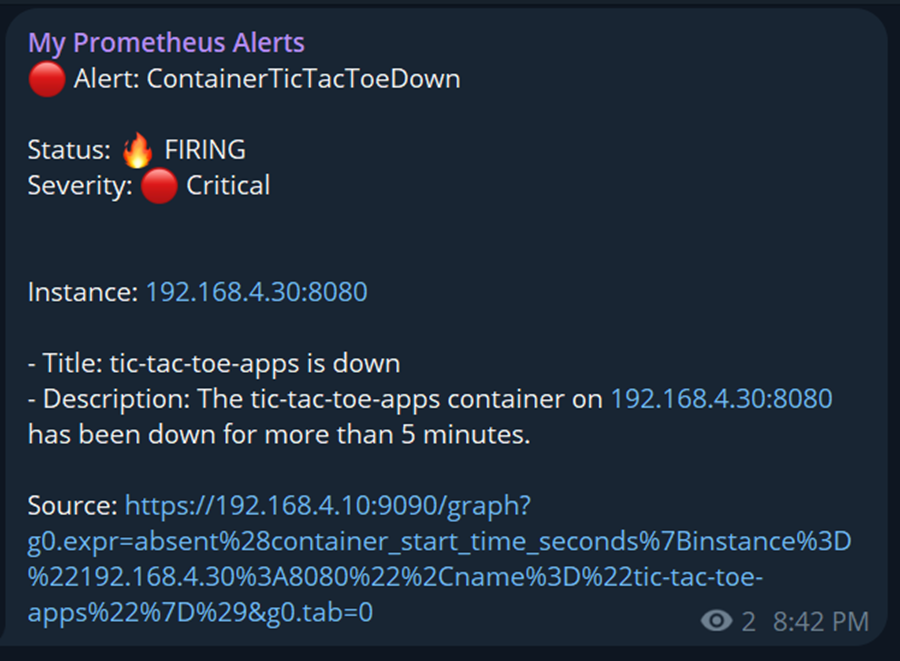
Cek pesan di telegram yang terkirim jika ada firing status.
Cek pesan di telegram yang terkirim jika ada resolve status.
Kesimpulan
Otomatisasi pada infrastruktur memungkinkan proses penskalaan menjadi lebih efisien. Bayangkan jika kita memiliki banyak node, konfigurasi manual akan menjadi tantangan besar. Inilah alasan kita menggunakan Ansible dan Terraform untuk mengelola infrastruktur secara otomatis. Selain itu, untuk memantau penggunaan, status, dan potensi masalah, diperlukan sistem monitoring dan deteksi anomali seperti Prometheus, Grafana, dan Alert Manager.
Referensi
- Monitoring Docker dengan cAdvisor.
- Konfigurasi Alert Manager dan Template.
- Ekspos Docker dengan protokol TCP.
- Instalasi Terraform.
- Instalasi Grafana, Alert Manager, Prometheus.
- Basic Authentication dan SSL Self-signed Prometheus.
- SSL Self-signed Grafana.
- Terraform Docker Provider.
- Membuat app password untuk Gmail.
- Membuat bot di Telegram.